
Renewed rate increases and higher inflation change the investment equation
The era of exceptionally cheap capital is over for now. On September 16, 2026, the Federal Reserve raised its target range for the federal funds rate by 0.25 percentage points to 3.75–4.00 percent, citing persistently elevated inflation. For real estate investors, this step underscores why lower financing costs cannot be relied upon when underwriting an acquisition or refinancing. The key question is whether a property remains financially viable if interest rates stay high or rise further. [10]
This new normal does not make US commercial real estate inherently unattractive. It does, however, demand greater discipline in pricing, capital structure, and asset management. Rising rents can partially offset higher financing costs, provided they translate into higher available earnings after operating expenses, vacancy, and leasing costs. Inflation alone guarantees neither rental growth nor rising property values.
Inflation has accelerated again
According to the Bureau of Labor Statistics release of October 14, consumer prices rose 3.7 percent year over year in September 2026, compared with 3.4 percent in August. The seasonally adjusted monthly increase was 0.6 percent. Core inflation, excluding food and energy, increased from 2.4 to 2.6 percent year over year. Energy prices rose 20.4 percent over the year, and gasoline accounted for more than half of the monthly increase in the overall index. Energy is therefore a major driver of price pressures, but not the only one. [11]
The September figures were released after the Fed’s decision. They do, however, confirm the concern that the hoped-for relief in financing costs may not materialize. The Fed will decide again on October 28.
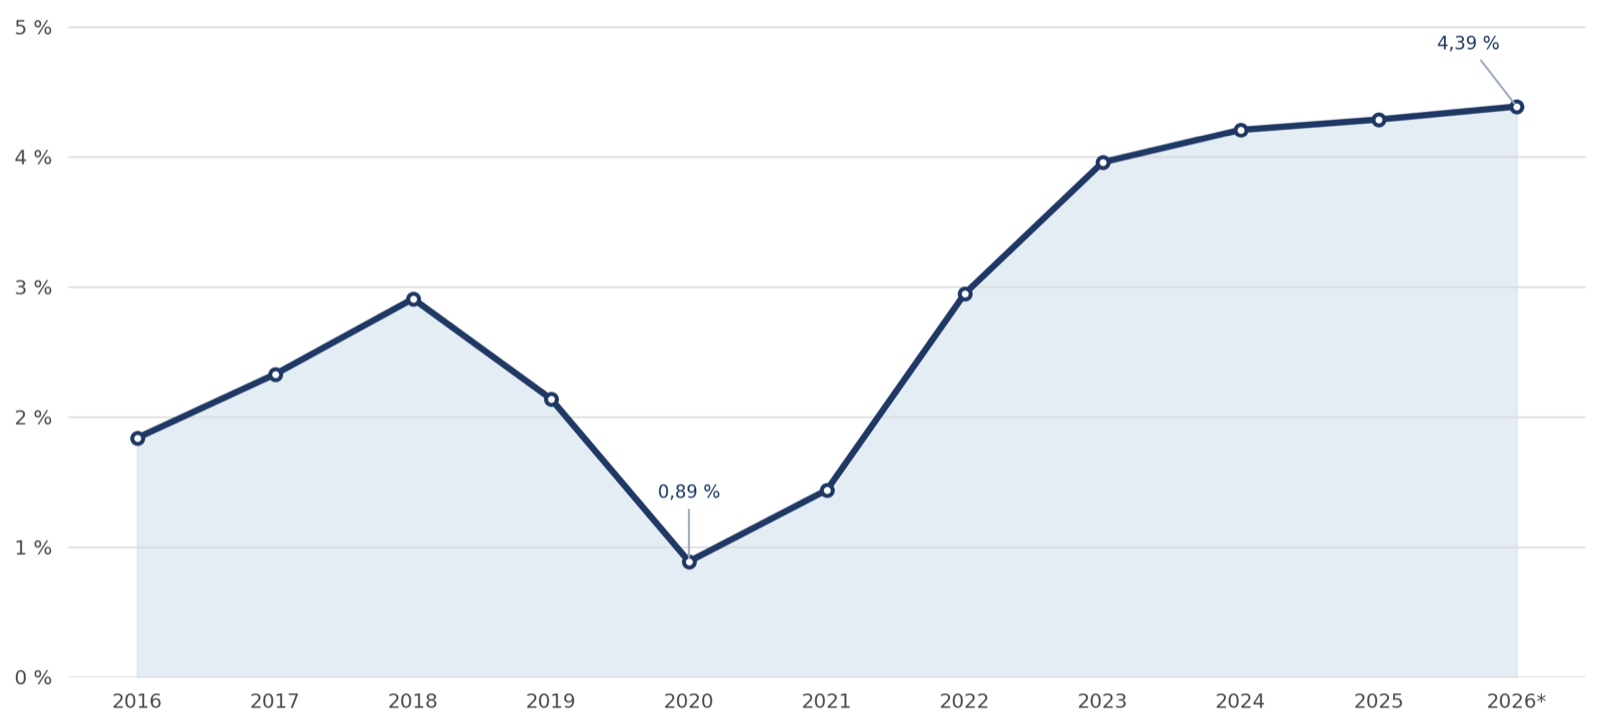
Moving beyond expectations of a return to low rates
From the financial crisis through 2021, many market participants became accustomed to low interest rates supporting property values. Commercial loans were available on exceptionally favorable terms in 2020 and 2021 in particular. At the same time, abundant capital compressed cap rates and pushed purchase prices higher.
That environment has fundamentally changed. The Fed’s policy rate primarily influences short-term financing conditions. Long-term fixed-rate loans depend more heavily on Treasury or swap rates of comparable maturity, credit spreads, leverage, and property quality. A Fed rate increase therefore does not automatically produce an equivalent increase in every commercial mortgage rate. Existing fixed rates remain unchanged during their fixed-rate term; floating-rate loans may become more expensive depending on their benchmark, reset dates, and interest rate limits.
Higher interest rates do not automatically mean lower values
A simplified income-property valuation is NOI divided by the capitalization rate. If the cap rate rises while NOI remains unchanged, value falls. If rents and NOI rise at the same time, however, they can cushion that effect.
How NOI Growth Can Offset a Higher Cap Rate
| Scenario | NOI | Cap Rate | Value |
|---|---|---|---|
| Base case | $1.0 million | 5.0% | $20.0 million |
| Higher cap rate without NOI growth | $1.0 million | 6.0% | $16.7 million |
| Higher cap rate with 20% NOI growth | $1.2 million | 6.0% | $20.0 million |
Simplified illustration excluding transaction costs, capital expenditures, and changes in other valuation assumptions.
This example shows why interest rates should never be considered in isolation. A property with below-market rents, near-term lease expirations, and limited competing supply may increase NOI substantially within a few years. A property with rents already at their ceiling, high vacancy, or expensive tenant improvements does not have the same protection.
Refinancing remains the most immediate challenge
Higher capital costs become especially apparent as loans mature. Many loans were originated when interest rates were lower and property values were higher. At refinancing, owners now face higher rates, more demanding debt service coverage requirements, and often lower loan-to-value limits.
Consider a simplified example: A property was purchased for $10 million with a $7 million loan. If its value later falls to $9 million and the bank will lend only 60 percent of value, the new loan is capped at $5.4 million. The owner must contribute approximately $1.6 million in additional equity to repay the existing debt. This refinancing gap can arise even at a well-managed property.
Even small rate changes matter on large loan balances. If the effective contractual interest rate on a $7 million floating-rate loan increases by 0.25 percentage points, annual interest expense rises by $17,500, assuming a constant balance. A one-percentage-point increase would add $70,000. These are illustrations, not forecasts; principal repayments and fees are excluded.
Owners respond by contributing additional equity or seeking preferred equity, mezzanine capital, or private lenders. Where the long-term outlook does not justify further investment, sales or restructurings become more likely. This can create opportunities for buyers with available capital, provided the price is consistent with the property’s prospects.
Lower leverage and more conservative financing
The traditional benefit of leverage is less dependable when financing costs are higher. If a property’s current yield is below the cost of debt, additional borrowing can reduce the current return on equity; principal repayments place further pressure on available cash flow. Leverage of, for example, 50–60 percent may therefore be more resilient than 70–75 percent. The appropriate level depends on debt service coverage, lease structure, and liquidity reserves rather than a general market rule.
More equity reduces dependence on future refinancing and provides flexibility for leasing, improvements, or temporary vacancies. Whether it reduces or improves the current return on equity depends on the relationship between property income and financing costs. Alongside a base case, investors should model higher refinancing rates, weaker rents, and rising expenses occurring together.
The US real estate market is becoming more differentiated
Broad statements about offices, shopping centers, or logistics properties are becoming less useful. Differences within an asset class can exceed those between asset classes. A Class A office building in Midtown Manhattan responds to different demand drivers than an older suburban office building. Limited retail supply in Miami creates a different rental environment from a market where new space can be built quickly.
Selected Market Examples
| Market | Segment | Second Quarter 2026 Metrics | Implications for Investors |
|---|---|---|---|
| Manhattan | Office | 11.02 million SF leased; 13.0% availability; $78.03/SF asking rent | Strong demand and a flight to quality support prime properties, while weaker buildings remain under pressure. |
| Miami-Dade | Office and Medical | Office $65.50/SF; Class A $73.37/SF; medical office $48.78/SF, up 8.0% year over year | High rents and limited quality space can partly offset higher capitalization rates. |
| Miami-Dade | Retail | 3.0% vacancy; $42.50/SF NNN; rent up 2.6% quarter over quarter | Limited supply and sustained tenant demand give well-positioned centers pricing power. |
| Southwest Florida | Office | Overall market stable; particularly strong fundamentals in Naples; Class A rents rising slightly | Building quality and the immediate location matter more than regional averages. |
| Houston | Retail and Industrial | Retail $21.43/SF, up 5.9% year over year; industrial $10.14/SF, down 1.6%; 26.1 million SF under construction | Rental trends within the same metro area can differ sharply by property type and construction volume. |
Source: Colliers market reports for the second quarter of 2026. Asking rents are not directly comparable across markets because lease structures and expense reimbursements vary.
Office performance increasingly reflects building quality
Manhattan demonstrates that office is not automatically a troubled asset class. Leasing volume reached 11.02 million square feet in the second quarter of 2026. Availability declined to 13.0 percent, while average asking rent increased to $78.03 per square foot, up 5.7 percent year over year. High-quality buildings in good locations benefit from the continuing flight to quality.
Miami-Dade shows similar strength at the upper end of the market. Average office asking rent reached $65.50 per square foot on a full-service basis and $73.37 for Class A space. Medical office asking rent was $48.78 per square foot, up 8.0 percent year over year, with vacancy at just 6.2 percent.
Southwest Florida is more stable, but increasingly selective. Naples recorded some of the region’s strongest fundamentals in the second quarter of 2026, while Fort Myers accounted for more of the move-outs. Demand focused on well-located, high-quality Class A buildings. Regional averages alone are therefore insufficient to value a Naples property. Building age, immediate location, parking, interior improvements, and the specific tenant mix determine the outcome.
Shopping centers benefit from limited supply
Well-positioned grocery-anchored and necessity-based shopping centers benefit from years of relatively limited retail construction. Miami-Dade retail vacancy was just 3.0 percent in the second quarter of 2026. Average asking rent rose to $42.50 per square foot NNN, up 2.6 percent from the previous quarter.
Houston shows that this pattern is not confined to Florida. Average retail asking rent reached $21.43 per square foot, up 5.9 percent year over year. Vacancy remained low at 5.8 percent. For existing owners, limited space, rising construction costs, and steady tenant demand can provide a sound foundation for NOI growth.
Logistics markets respond differently to new construction
Miami and Houston illustrate the importance of local supply in industrial and logistics markets. Miami-Dade asking rents rose to $17.19 per square foot NNN in the second quarter of 2026, up 1.5 percent year over year. At the same time, new completions pushed vacancy up to 7.7 percent.
Houston recorded strong net absorption of 7.6 million square feet. Nevertheless, average asking rent of $10.14 per square foot was 1.6 percent below the prior-year level. More than 26 million square feet were under construction. A market can therefore experience strong demand for space and limited rental growth simultaneously when supply responds quickly.
NOI growth becomes the principal protection
Inflation protection depends on the lease
Commercial rents do not automatically increase with the Consumer Price Index. Fixed annual increases may lag inflation; index-linked adjustments apply only under the agreed terms and may be capped. With annual rent growth of 3 percent and inflation of 3.7 percent, the rent’s purchasing power declines by approximately 0.7 percent. This is an illustration, not a forecast of future inflation.
Meanwhile, energy, maintenance, repairs, and tenant improvements may become more expensive. NNN leases allow many operating expenses to be passed through, but only to the extent permitted by the lease. Reimbursement caps, exclusions, vacant-space allocations, and nonrecoverable capital expenditures remain the owner’s responsibility. Higher total occupancy costs also burden tenants and may weaken their ability to pay or absorb further rent increases.
A simple example illustrates the effect: With $1 million in annual revenue and $300,000 in operating expenses, NOI is $700,000. If revenue rises by 3 percent while owner-borne expenses rise by 8 percent, NOI increases to just $706,000, or approximately 0.9 percent. Higher nominal rents alone are therefore not enough; the decisive measure is net operating income before financing costs and income taxes.
The cap rate alone consequently says little about an investment’s quality. A property with a 6 percent initial yield may be more attractive than one yielding 7 percent if the first is leased well below market and the second already commands top-of-market rents.
During acquisition due diligence, investors should address the following questions in particular:
- How do contractual rents compare with current market rents?
- When do the major leases expire, and how likely are tenants to renew?
- What tenant improvements and leasing commissions will new leases require?
- How are vacancy, absorption, and new construction developing in the specific submarket?
- Which operating expenses can be passed through to tenants under the leases?
- How is NOI realistically expected to develop over three, five, and ten years?
Mark-to-market potential deserves particular attention, but it must be adjusted for the cost and time required to re-lease space. Higher market rents do not create value if improvements, commissions, and downtime consume the incremental income.
Buying below replacement cost
Price per square foot relative to replacement cost is becoming an important acquisition criterion. If an existing logistics or retail property can be acquired for $200 per square foot while comparable new construction, including land, would cost $300, the existing property has a competitive advantage. As long as market rents do not justify new construction, additional supply remains constrained.
A discount to replacement cost is valuable only if the building remains functional and its location retains long-term demand. A low price for an obsolete office building may be misleading if its layout, building systems, or parking ratio prevent economically viable leasing.
Existing low-cost loans become an asset
A long-term loan carrying a 3 percent interest rate has economic value in today’s environment. If the loan is assumable, it can materially improve a buyer’s cash flow and return on equity. Acquisition due diligence should therefore establish whether existing debt can be assumed, what lender approvals are required, and what fees or adjustments apply.
Real estate lending as an alternative to direct ownership
Higher interest rates also broaden the investment universe. Private real estate loans, mezzanine financing, and preferred equity can offer attractive current returns, supported by property collateral or a priority position in the capital structure, depending on the instrument. Investors should consider not only which property to acquire, but also where in its capital structure to invest.
Senior debt, mezzanine debt, preferred equity, and common equity have different rights, security, and exposure to losses. A higher yield is attractive only when structure, leverage, covenants, and the exit scenario adequately reflect the additional risk.
Longer holding periods and more active asset management
During the low-rate era, rising valuations could generate part of an investor’s return. Today, more value must come from operations. Successful owners reduce vacancy, renew leases early, raise below-market rents, control operating expenses, and reposition space selectively.
A longer investment horizon is therefore becoming more important. A ten-year plan allows owners to manage improvements, leasing, and NOI growth through multiple market cycles. Falling interest rates may support a future sale, but they do not guarantee a higher valuation. Rent trends, capital requirements, and future buyers’ return expectations also shape the exit.
Conclusion
The renewed rate increase and recent acceleration in inflation raise the demands on US commercial real estate investments. Higher capital costs can weigh on valuations, while rising operating expenses can absorb part of the rental growth. Well-leased properties with effective expense recovery, moderate leverage, and realistic rental growth potential can nevertheless deliver attractive current income.
For our acquisition and portfolio reviews, the implications are clear: Financing and refinancing must remain viable under less favorable assumptions. Rent adjustments and expense reimbursements must be assessed lease by lease, and every underwriting should include reserves for vacancy, tenant improvements, and repairs. Future rate cuts remain a possible benefit, but must not be a prerequisite for an investment’s success.
Sources and Data
- Federal Reserve Bank of St. Louis FRED series GS10
- Colliers Manhattan Office Market Report Q2 2026
- Colliers Miami Dade Office Market Report Q2 2026
- Colliers Miami Dade Medical Office Market Report Q2 2026
- Colliers Miami Dade Retail Market Report Q2 2026
- Colliers Miami Dade Industrial Market Report Q2 2026
- Colliers Southwest Florida Office Market Report Q2 2026
- Colliers Houston Retail Market Report Q2 2026
- Colliers Houston Industrial Market Report Q2 2026
- Federal Reserve, FOMC statement dated September 16, 2026 https://www.federalreserve.gov/newsevents/pressreleases/monetary20260916a.htm
- Bureau of Labor Statistics, Consumer Price Index for September 2026, released October 14, 2026 https://www.bls.gov/news.release/cpi.nr0.htm?d=20261014
As of October 2026. Regional market data refer to the second quarter of 2026. The calculations are illustrative and are not forecasts.